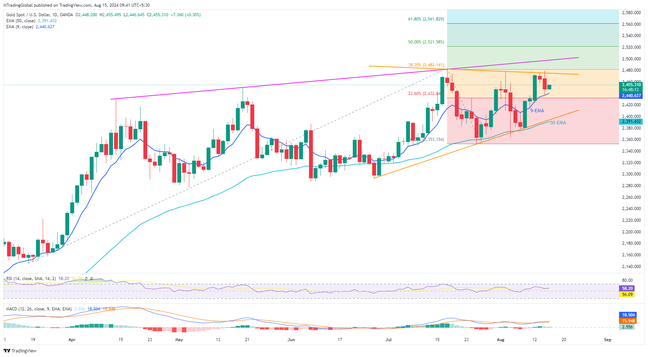
Gold has ended a two-day drop by bouncing off its 9-day Exponential Moving Average (EMA) within a symmetrical triangle pattern that's been forming for seven weeks. This bounce supports the idea that the Fed might cut rates, together with the positive MACD signals and the trend-favorable RSI line. The key levels to watch are the triangle's range of $2,475 to $2,393 and the 50-day EMA support at $2,391.
If gold moves past $2,475, it could test an upward resistance line from early April, reaching around $2,498. After that, $2,500 will be an additional hurdle for the metal before potentially rising to $2,522 and $2,562, which are based on 50% and 61.8% Fibonacci Extensions of gold's moves from March to July.
If gold falls below $2,391, it might drop to the late July low of about $2,353 and then to $2,350. There's also a strong support region between $2,293 and $2,285 from late April to June, which if broken, could push gold towards $2,200.
Overall, gold is performing well due to positive technical indicators and concerns about possible US Fed rate cuts, supported by recent US inflation data.
Join us on FB and Twitter to stay updated on the latest market events